
 Available 24/7
Key Findings
- Idaho recorded 252 traffic deaths in 2025, up 5.9 percent from 2024, even though total crashes stayed almost flat at 28,127.
- Saturday produced the fewest crashes of any day in 2025, 3,471, but the most deaths, 43, more than any other day of the week.
- An animal in the roadway was the single most common cause of single-vehicle crashes in 2025, ahead of speeding and lane departure.
- Alcohol and drug impairment was cited in 21 percent of fatal crashes but only 5 percent of crashes overall, a four-fold overrepresentation.
- US-95, which runs the length of North Idaho, recorded more fatal crashes over five years than any other road in the state, ahead of I-84 and nearly double I-15.
- Male drivers made up 51 percent of Idaho’s licensed drivers in 2025 but accounted for 79 percent of drivers in fatal crashes.
- Idaho’s mandatory per-person insurance minimum, $25,000, is well under one percent of the $14.2 million the state’s own model assigns to a single traffic death.
- Deaths climbed for the third straight summer during Idaho’s “100 Deadliest Days,” from 82 in 2024 to 88 in 2025 to 90 in 2026.
- Fewer than 5 percent of personal injury claims nationwide ever become lawsuits, and of those, roughly 95 percent settle before trial.
Why We Built This Report
There are thousands of traffic accidents annually in Idaho. These collisions vary in cause, severity, and cost, with some of these crashes resulting in lawsuits against negligent drivers for personal injury damages.
Clients keep asking us how dangerous their daily drive really is, which roads carry the most risk, and what their insurance actually covers if the worst happens. This report answers all three, built entirely from the Idaho Transportation Department’s own 2025 crash data, current state law, and current litigation and insurance figures, with a named source behind every number.
We provide an overview of Idaho car accident and lawsuit statistics. If a liable driver hurt you or someone you loved in a motor vehicle collision, an Idaho car accident lawyer with our law firm can help you with a claim for compensation
Recent Idaho Car Accident Statistics
According to the Idaho Traffic Crashes 2025, released in August 2026,
- Idaho logged 28,127 crashes in 2025, down 0.1 percent from 28,158 in 2024.
- Fatal crashes rose from 219 in 2024 to 231 in 2025, a 5.5 percent increase.
- Deaths rose from 238 in 2024 to 252 in 2025, a 5.9 percent increase.
- 11,845 people were injured in Idaho crashes in 2025, and 1,256 of those injuries were classified as serious.
Idaho’s Traffic Crash Clock: 2025
The Office of Highway Safety turns the year’s crash totals into a clock, and the pace is worth sitting with.
- A traffic crash occurred every 19 minutes.
- A person was injured every 44 minutes.
- A person was killed every 35 hours.
- A motorcyclist was killed or injured every 12 hours.
- A pedestrian was killed or injured every 32 hours.
- A bicyclist was killed or injured every 29 hours.
- A person was killed in an impaired driving crash every 4.2 days.
- A person was killed in an aggressive driving crash every 3.7 days.
- An unbelted vehicle occupant was killed every 5.1 days.
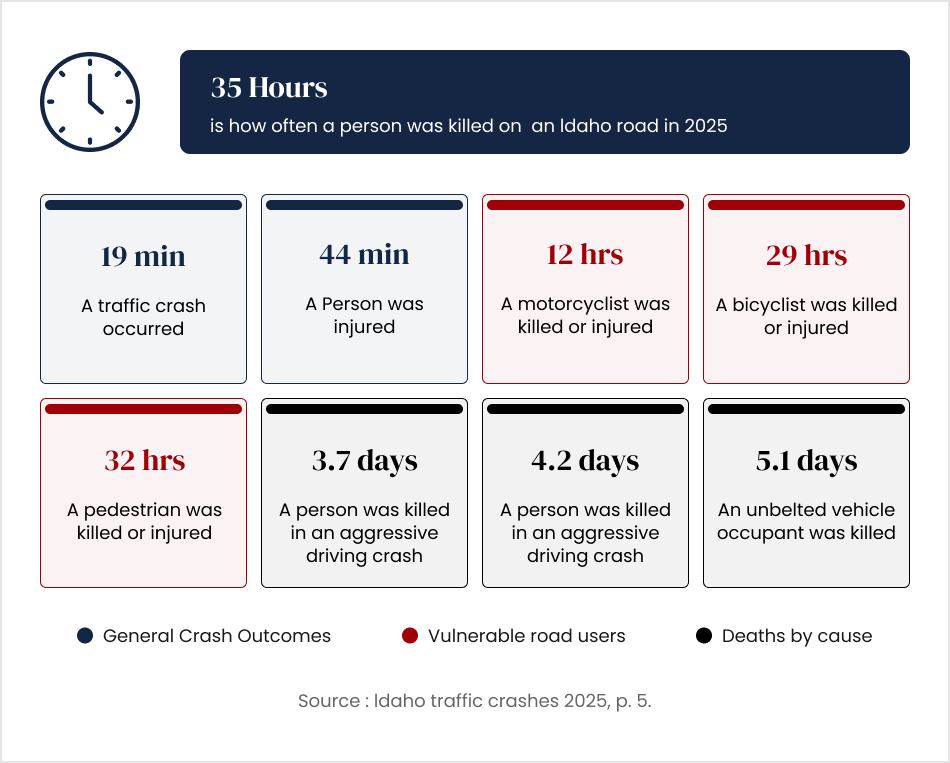
A person is injured roughly 48 times more often than someone is killed, since an injury occurs every 44 minutes against a death every 35 hours. Two intervals on this clock stand out for how tight they are relative to how few of these vehicles are actually on Idaho roads.
Motorcycles make up only about 3 percent of Idaho’s registered vehicles, yet a motorcyclist is killed or injured every 12 hours, a faster pace than the pedestrian or bicyclist intervals. That gap says less about how many motorcycles share the road and more about how exposed a rider is the moment a crash happens.
The Most Dangerous Day and Month to Drive in Idaho
Saturday had the fewest total crashes of any day in 2025, at 3,471, but the most fatal crashes, at 43. That is more fatal crashes than Thursday produced with its 4,604 total crashes, which resulted in 31 deaths. Sunday follows a similar pattern. It had the lowest total crash count of the week, at 2,603, yet the second-highest fatal crash count, at 38. Fewer cars are on the road on weekends, and the crashes that do happen are more likely to be fatal.

By month, June had the most fatal crashes in 2025, with 30, followed by July with 25 and September with 25. September and October also had the highest total crash counts of any months in the year, which the report attributes in part to seasonal traffic patterns rather than weather, since winter crashes tend to be less severe as drivers slow down for ice and snow.
Idaho’s Five-Year Crash Trend (2021 to 2025)
A single year of data can look like a blip. Idaho’s own five-year table shows the trend is not.
| Measure | 2021 | 2022 | 2023 | 2024 | 2025 |
| Total crashes | 27,549 | 27,661 | 27,679 | 28,158 | 28,127 |
| Fatal crashes | 246 | 194 | 242 | 219 | 231 |
| Deaths | 273 | 215 | 275 | 238 | 252 |
| Injury crashes | 8,665 | 8,443 | 8,261 | 8,377 | 8,370 |
| People injured | 12,616 | 12,155 | 11,859 | 11,897 | 11,845 |
Total crashes have stayed close to 28,000 for three straight years. Deaths have swung from as low as 215 to as high as 275 in the same span, without a clear yearly pattern. That volatility matters, because it means a single bad year on Idaho roads is not an anomaly the state is likely to age out of on its own.
The picture softens slightly once the data is adjusted for how much more Idahoans are actually driving. Idaho’s overall crash rate per 100 million vehicle miles traveled fell from 142.7 in 2021 to 136.6 in 2025, a decline of roughly 4 percent, because the miles Idahoans drove grew faster than the raw number of crashes.
The fatality rate tells a more mixed story. It rose from 1.19 per 100 million miles in 2024 to 1.22 in 2025, but that figure still sits below the 1.40 and 1.41 rates recorded in 2023 and 2021. Idaho’s roads are not getting steadily safer or steadily more dangerous. They are volatile from one year to the next, which is exactly why a single year of improvement should not be read as a trend reversal.
Idaho’s “100 Deadliest Days”
The Idaho Transportation Department tracks the state’s “100 Deadliest Days,” the stretch between Memorial Day and Labor Day when serious and fatal crashes historically climb. More people are out of school, on vacation, and traveling, and that brings more risky driving, including impaired and distracted driving.
| Year | Deaths During the 100 Deadliest Days |
| 2024 | 82 |
| 2025 | 88 |
| 2026 | 90 |
Three summers in a row, the death toll during this 100-day window has climbed. The 2026 period also saw 59 fatal crashes, down from 87 fatal crashes the year before, which means fewer crashes are resulting in death overall, but the crashes that do turn fatal are increasingly likely to kill more than one person.
Idaho’s Most Dangerous Highways
A statewide analysis of five years of fatal crash data, released in January 2026, ranked Idaho’s roads by total fatal crashes rather than by traffic volume. The result runs against a common assumption, since interstates were not the deadliest road type. State highways and U.S. highways accounted for 75 percent of Idaho’s fatal crashes over the five-year period, compared to 24 percent on interstates.
| Rank | Road | Fatal Crashes, Five-Year Total |
| 1 | US-95 | 84 |
| 2 | I-84 | 81 |
| 3 | US-20 | 56 |
| 4 | I-15 | 38 |
| 5 | SR-55 | 35 |
| 6 | US-93 | 31 |
| 7 | US-30 | 24 |
| 8 | US-12 | 20 |
| 9 | SR-75 | 18 |
| 10 | US-26 | 18 |
An ITD official quoted in the piece explained the pattern by pointing to how these roads function. U.S. and state highways carry the daily traffic between Idaho communities, so the volume of local travel on them is part of why they carry more fatal crashes than the interstates that pass through the state.
The design of the roads plays a role too. State and U.S. highways mix higher speeds with frequent driveways, intersections, pedestrians, cyclists, and slower farm or recreational vehicles, and many stretches carry no median to separate opposing lanes. Interstates limit access to defined on-ramps and off-ramps and physically separate opposing traffic, which is part of why they carry heavy volume with comparatively fewer fatal crashes per mile.
US-95 illustrates the pattern directly. It runs the length of North Idaho, through the counties our Coeur d’Alene office serves, and much of its route is a two-lane highway carrying local commuters, freight, and recreational traffic on the same narrow roadway. I-84, in second place, is one of the state’s busiest freight corridors, which means more vehicles are exposed to risk on it even though the interstate design itself tends to be safer per mile driven than a comparable two-lane highway.
Top Contributing Factors in Idaho’s Fatal Crashes
An investigating officer can list up to three contributing circumstances per vehicle in a crash. Comparing how often a factor shows up in fatal crashes against how often it shows up in Idaho crashes overall reveals which behaviors are most likely to turn deadly when they occur.
| Factor | Share of Fatal Crashes | Share of All Crashes |
| Alcohol or drug impairment | 21% | 5% |
| Failure to maintain lane | 17% | 8% |
| Speed | 15% | 8% |
| Inattention or distraction | 8% | 14% |
| Failure to yield right of way | 5% | 15% |
| Failure to obey a signal or stop sign | 4% | 5% |
| Following too closely | 1% | 13% |
The comparison across crash types matters more than the fatal numbers alone. Alcohol and drug impairment is cited in only 5 percent of all Idaho crashes, but climbs to 21 percent once a crash turns fatal, a fourfold overrepresentation. Failing to maintain a lane shows a similar jump, from 8 percent of all crashes to 17 percent of fatal ones. Speed follows the same pattern, roughly doubling its share once a crash becomes fatal.
Other factors run the opposite direction. Following too closely is cited in 13 percent of all Idaho crashes, more often than alcohol, speed, or lane departure combined, yet it accounts for only 1 percent of fatal crashes. Failure to yield behaves the same way, common overall but rarely fatal on its own. The pattern suggests that some of Idaho’s most frequent driving mistakes, like tailgating or misjudging a merge, tend to produce fender benders rather than fatalities, while impairment, lane departure, and speed are the factors most likely to turn a crash deadly when they occur.
A Closer Look: Impaired, Aggressive, Distracted, and Youthful Driving in 2025
- Impaired driving: 1,613 crashes, 87 deaths, a fatality rate of about 5.4 percent per crash, and an estimated economic cost of $1.53 billion.
- Aggressive driving: 13,610 crashes, 99 deaths, a fatality rate of about 0.7 percent per crash, and an estimated economic cost of $2.7 billion, nearly half of the total cost of all Idaho crashes.
- Distracted driving: 4,396 crashes, 34 deaths, a fatality rate of about 0.8 percent per crash, and an estimated economic cost of $980 million.
- Youthful drivers, ages 15 to 19: 6,092 crashes, 32 deaths, and an estimated economic cost of $954 million. Youthful drivers were 2.1 times as likely as all other drivers to be involved in a fatal or injury crash in 2025.
Comparing crash counts to deaths within each category shows which behavior is most lethal once a crash actually happens, rather than which behavior causes the most total damage. Impaired driving proved the most lethal per crash of the four, at roughly 5.4 percent of impaired driving crashes ending in death.
Aggressive driving crashes happen far more often, at 13,610 in 2025, but kill at a lower rate per crash, about 0.7 percent, which is why aggressive driving still produces the highest total cost and the most total deaths even though it is proportionally less dangerous than impairment. Distracted driving sits in between the two, killing at a rate of about 0.8 percent per crash.
These are all forms of negligent driving. If a negligent driver injured you or someone you love in a collision, an Idaho personal injury lawyer with our firm can handle your car accident claim.
Who’s Most at Risk: Age and Gender in Idaho Crashes
Idaho’s crash data also breaks down cleanly by who is behind the wheel, and two patterns stand out.
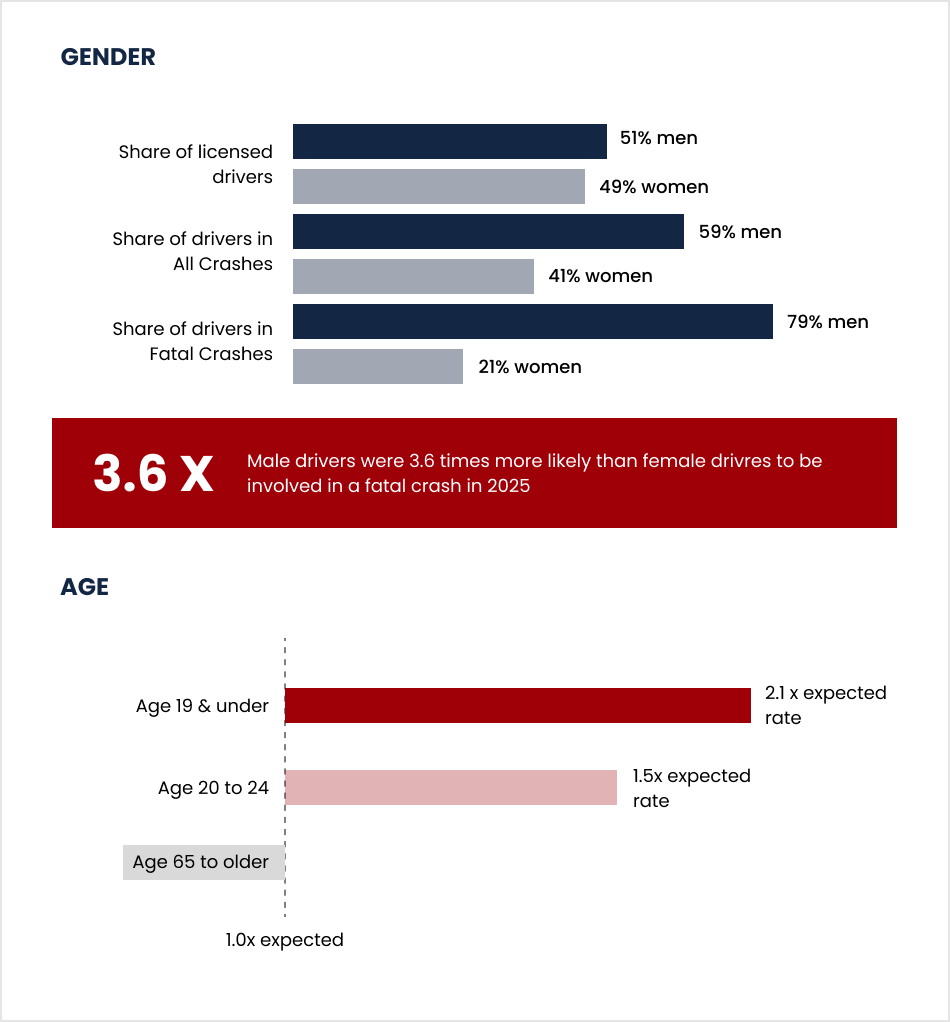
Men are heavily overrepresented in the state’s worst crashes. Male drivers made up 51 percent of Idaho’s licensed drivers in 2025, but accounted for 59 percent of drivers in all crashes and 79 percent of drivers in fatal crashes, a rate 3.6 times higher than female drivers. The gap is not simply a matter of men driving more. It reflects how much more often a fatal crash specifically, rather than a crash of any kind, involves a male driver.
Age tells a second story. Drivers age 19 and younger were involved in fatal or injury crashes at 2.1 times the rate you would expect from their share of licensed drivers, and drivers 20 to 24 were involved at 1.5 times the expected rate. Drivers 65 and older sit at the opposite end. Despite now making up 23 percent of Idaho’s licensed drivers, up from 16 percent in 2010 as the state’s population ages, older drivers are involved in only about half as many crashes as their numbers would predict.
Vulnerable Road Users: Pedestrians, Bicyclists, and Motorcyclists
Not everyone hurt on Idaho’s roads is inside a vehicle, and 2025 was a harder year for people outside one.
Pedestrian crashes rose 7.8 percent in 2025, to 264, and pedestrian deaths rose 14.3 percent, to 16. Ninety-four percent of pedestrians involved in a crash suffered some degree of injury. Nearly all of the pedestrians killed, all but two, were 22 or older, and two-thirds were over 40, which cuts against the assumption that pedestrian risk falls mainly on children.
Bicycle crashes climbed even more sharply, up 25.9 percent to 311, with bicyclist deaths up a third, to four. Ninety-five percent of bicyclists in a crash were injured. Helmet use remains low across the board, at just 26 percent of bicyclists involved in crashes, and the gap runs by age. Fifty-six percent of bicyclists over 65 involved in a crash were wearing a helmet, compared with only 20 percent of bicyclists 19 and younger.
Motorcycle crashes rose 10.5 percent, to 695, and motorcyclist deaths rose to 49. Eighty-seven percent of motorcyclists in a crash were injured. Idaho law requires a helmet only for riders and passengers under 18, and the data reflects that split. Eighty-one percent of underage riders in crashes were wearing a helmet, compared with 71 percent of riders 18 and older, who are legally free to ride without one.

Animal Collisions: Idaho’s Leading Risk in Single-Vehicle Crashes
Idaho’s fatal crash picture looks different once single-vehicle crashes are pulled out on their own. Single-vehicle crashes made up only 28 percent of all Idaho crashes in 2025, but they accounted for 46 percent of all fatal crashes and were 2.2 times as likely to be fatal as multi-vehicle crashes.
Within that category, an animal in the roadway was the most common contributing circumstance, cited in 23 percent of single-vehicle crashes, ahead of speed at 18 percent and failure to maintain lane at 15 percent. Of the 107 fatal single-vehicle crashes in 2025, 83 happened on rural roads, and a rollover was the most harmful event, accounting for 55 percent of single-vehicle deaths.

The Economic Cost of Idaho Crashes
The Idaho Transportation Department calculates a dollar cost for every crash outcome, using federal cost-per-injury values. The total for 2025 came to just over $6.08 billion, or $2,996 for every person living in Idaho.
| Outcome | Occurrences in 2025 | Cost Per Occurrence | Total |
| Fatality | 252 | $14,200,000 | $3,578,400,000 |
| Suspected serious injury | 1,256 | $679,115 | $852,968,975 |
| Suspected minor injury | 4,275 | $184,970 | $790,745,151 |
| Possible injury | 6,314 | $94,451 | $596,366,405 |
| No injury | 54,959 | $4,785 | $262,969,582 |

The state’s own analysis of who actually pays these costs is worth pausing on. Combining medical, lost income, insurance, and legal costs across every category, ITD found that insurers cover just over 52 percent of the total, individuals and households pay another 25 percent directly, and various levels of government cover most of the remaining share.
The “individuals and households” category captures medical bills, lost wages, and other costs that injured people absorb themselves, whether because they were uninsured, underinsured, or because a claim simply did not cover the full cost of the injury. That gap, close to a quarter of every dollar a crash costs in Idaho, is exactly what a personal injury claim exists to close.
Recoverable Car Accident Compensation
Idaho law separates compensation into two broad categories. Economic damages have a receipt or a calculation behind them, like medical bills, lost wages, and property repair costs, and Idaho places no cap on economic damages in a car accident case.
Non-economic damages, which cover pain and suffering, emotional distress, and diminished quality of life, are capped under Idaho Code § 6-1603. The cap started at $250,000 in 2004 and adjusts each year with the state’s average wage. For the year running from mid-2025 to mid-2026, it sits at $509,013.28. The cap does not apply when the injury resulted from willful or reckless misconduct, or from conduct that amounts to a felony, which can matter directly in a crash caused by an impaired or fleeing driver.
If a liable party caused your car accident, that party may be financially responsible for your damages. In general, you can pursue compensation for the following with an auto insurance claim or car accident lawsuit in Idaho:
- Emergency transportation and medical treatment
- Hospital stays
- Doctor fees
- Medical procedures
- Mobility aids
- Prescription drugs
- Physical therapy and rehabilitation
- Nursing and attendant care
- Lost income and lost future earning capacity
- Vehicle damage
- Household services you can no longer perform
- Physical pain and suffering (subject to the cap described above)
- Mental and emotional distress (subject to the cap described above)
- Diminished quality of life (subject to the cap described above)
- Wrongful death of a loved one
The Gap Between What Insurance Covers and What a Crash Actually Costs
Idaho law requires drivers to carry only $25,000 per person and $50,000 per accident in bodily injury liability coverage, along with $15,000 in property damage coverage. That is one of the lower sets of state minimums in the country.
Set that minimum against what ITD’s own 2025 data says a crash actually costs. A suspected serious injury averages $679,115. A suspected minor injury averages $184,970. A fatality is valued at $14.2 million. A single serious injury can cost 27 times more than Idaho’s minimum coverage requirement, which means a driver who carries the legally required minimum can still leave an injured person more than $650,000 short after their own policy is exhausted.
Idaho does not require drivers to carry uninsured or underinsured motorist coverage, though insurers must offer it, and a driver can decline it in writing. That coverage exists specifically to close the gap between what an at-fault driver’s minimum policy pays and what an injury actually costs, which makes it one of the more valuable, and most commonly declined, coverages a driver in Idaho can carry.
Part of why this gap keeps widening is that injury costs are rising faster than nearly everything else drivers buy. CCC Intelligent Solutions, which tracks paid auto injury claims across the industry, found the average paid bodily injury outcome climbing 36 percent since late 2020, driven by a mix of higher medical costs, more attorney involvement in claims, and larger verdicts in the cases that do reach a jury. Idaho’s flat dollar insurance minimum has not moved to keep pace with any of that.
That combination, rising injury costs and a static coverage floor, is a large part of why an insurance claim alone is often not enough, and why so many crash victims end up needing a lawsuit, an underinsured motorist claim, or both, to be made whole.
Idaho Car Accident Lawsuit Statistics
Most Idaho car accident claims never reach a courtroom. Nationwide, industry and government data both point in the same direction.
| Measure | Figure | Source |
| Average bodily injury liability claim, 2022 | $24,681 | Insurance Information Institute (Triple-I) |
| Average bodily injury liability claim, 2024 | $28,278, up 15% from 2022 | Insurance Information Institute (Triple-I) |
| Average property damage liability claim, 2022 | $6,024 | Insurance Information Institute (Triple-I) |
| Average property damage liability claim, 2024 | $6,770 | Insurance Information Institute (Triple-I) |
| Personal injury claims that become lawsuits | About 4 to 5% | U.S. Dept. of Justice, Bureau of Justice Statistics |
| Filed lawsuits that settle before trial | About 95 to 96% | U.S. Dept. of Justice, Bureau of Justice Statistics |
| Plaintiff win rate, cases that reach trial | About 61% | Bureau of Justice Statistics |
The bodily injury figures are worth sitting with. The average liability payout for someone’s injuries rose 15 percent in just two years, from $24,681 in 2022 to $28,278 in 2024, while property damage payouts rose a more modest 12 percent in the same period. Medical and legal costs are climbing faster than the price of fixing a car, and Idaho’s flat $25,000 per-person minimum has not moved to keep pace.
None of that changes how rarely a case actually reaches a jury. It does mean that when a case is strong enough to justify litigation, the number an insurer is negotiating against has grown substantially in just a few years, which is one reason insurers are more willing to settle a well-documented claim before it ever reaches a courtroom.
When Should You File a Car Accident Lawsuit?
You should file an auto insurance claim right away after any crash. If the insurance company will not offer full and fair compensation, you may need to take legal action instead.
Idaho Statutes § 5-219 generally gives you two years to file a personal injury or wrongful death lawsuit. If you do not pursue your case before the statute of limitations runs out, you will likely be unable to seek damages in court, no matter how clear the other driver’s fault was.
Two Rules That Shape Every Idaho Injury Claim
Comparative negligence. Idaho follows a modified comparative negligence rule under Idaho Code § 6-801. Your compensation is reduced by your own percentage of fault, and if you are found 50 percent or more at fault, you recover nothing. Insurance adjusters know this, and they will often argue hard over small percentages of fault because each point can change what they owe.
The two-year deadline. As described above, Idaho Statutes § 5-219 generally gives you two years from the date of the crash to file suit. Claims against a government entity carry shorter notice deadlines, and claims involving a minor follow their own rules, so it is worth confirming your specific deadline rather than assuming the standard two years applies.
Do You Need an Idaho Car Accident Lawyer?
If you or someone you love suffered a crash injury, an Idaho car accident lawyer with our firm can help you navigate your claim or lawsuit. We can investigate the collision and build a case proving you deserve compensation. We can:
- Gather evidence, including police reports, eyewitness statements, video, photographs, and testimony from relevant case experts
- Identify every liable party
- Identify and pursue all of your recoverable damages
- Draft and file insurance claims
- Handle case-related communications, deadlines, and paperwork
- Negotiate for the maximum settlement possible
- Prepare your case for civil court and represent you at trial if necessary
- Provide you with frequent and timely updates
Contact Sargent Law Firm Injury Lawyers About Your Idaho Car Accident
Idaho’s own crash data shows that traffic collisions injure thousands of people every year, and that the cost of those injuries is rising faster than the insurance minimums meant to cover them. If a negligent driver hurt you, an Idaho car accident lawyer with Sargent Law Firm Injury Lawyers can help you with a claim or lawsuit.
Our firm has over a decade of experience fighting for accident victims, and we have recovered over $40 million in settlements and judgments for our clients. Contact us online or call 844-SARGENT for a free case evaluation, available 24/7. We work on contingency, so you owe us nothing until we win your case.
Frequently Asked Questions
How many car accidents happen in Idaho each year?
Idaho recorded 28,127 crashes in 2025, including 231 fatal crashes and 252 deaths, according to the Idaho Transportation Department’s 2025 crash report.
What is Idaho’s most dangerous highway?
US-95 recorded the most fatal crashes of any Idaho road over the five-year period ending in 2025, followed by I-84 and US-20, according to a statewide analysis of NHTSA fatal crash data.
Who is most at risk on Idaho’s roads?
Male drivers, drivers under 25, and people involved in single-vehicle or impaired-driving crashes face the highest risk. Male drivers made up 79 percent of drivers in fatal crashes in 2025 despite being 51 percent of Idaho’s licensed drivers.
How long do I have to file a car accident lawsuit in Idaho?
Idaho Statutes § 5-219 generally gives you two years from the date of the crash to file a personal injury or wrongful death lawsuit.
Do most car accident claims end up in court?
No. Only about 4 to 5 percent of personal injury claims become lawsuits, and of those, roughly 95 to 96 percent settle before trial, according to Bureau of Justice Statistics data.
What’s the average car accident settlement or claim payout?
The average bodily injury liability claim paid nationally in 2024 was $28,278, according to the Insurance Information Institute, up from $24,681 in 2022. Actual settlement values in any individual Idaho case depend on the facts and are subject to Idaho’s non-economic damages cap in most circumstances.
Methodology and Primary Sources
Every figure in this report is drawn from a named source and current as of the date cited. Idaho’s crash, demographic, and vulnerable-road-user data all come directly from the Idaho Transportation Department’s Office of Highway Safety, which draws on crash reports filed by every law enforcement agency in the state, so the true number of crashes, particularly minor ones that go unreported, is likely somewhat higher than what appears here. Insurance and litigation figures are national averages, since no Idaho-specific claims database is publicly available, and individual case values vary by county, by court, and by the facts of the crash.
Idaho Crash Data
- Idaho Transportation Department, Office of Highway Safety, Idaho Traffic Crashes 2025 (released August 2026).
- Idaho Transportation Department, Idaho’s 2025 100 Deadliest Days Result in 88 Fatalities (2025) and 2026 100 Deadliest Days release (September 2026).
Idaho Law
- Idaho Statutes § 5-219, statute of limitations for personal injury and wrongful death.
- Idaho Code § 6-801, comparative negligence.
- Idaho Code § 6-1603, limitation on non-economic damages.
- Idaho Department of Insurance, Required Auto Coverage.
Insurance and Litigation Data
- Insurance Information Institute (Triple-I), Facts + Statistics: Auto Insurance, citing ISO, a Verisk Analytics business.
- Bureau of Justice Statistics civil trial and settlement data, as compiled and cited across multiple personal injury legal resources tracking BJS’s published tort trial figures.
- CCC Intelligent Solutions paid bodily injury claim data, as reported in industry analysis of auto insurance claim trends.
News Coverage
- KIFI Local News 8, “Idaho’s Most Dangerous Roads: US-95 and State Highways Outpace Interstates in Deadly Crashes” (January 2026), citing a nationwide ISelect analysis of NHTSA/FARS data.